Supplemental Materials
Optical
fiber light source directs neurite growth
Forrest Jesse1*,
Zhenjiang Miao1, Li Zhao2, Yao Chen2, Yuan
Yuan Lv2
1Human Computer Interface Lab,
Beijing Jiaotong University, Beijing, 100044, China
2Department of Physiology, Beijing
Sports University, Beijing, 100084, China
*jesse@jesse.org
1. Fiber Tapers
The simplest implementation of the
fiber taper is a relatively wide taper that is stiff enough to not bend under
its own weight or be pushed by the liquid it is immersed in. The tapers we found most easy to work with were similar in width to a
neurite. Without adding lenses or shaping
the end of the taper, our wide
(micrometer) taper will cause a wide beam, which in our experiments
often encompassing the entire growth area of the neurite. Unless energy is
closely regulated according to the emission tip��s distance
from target, a wide beam can cause neurites to quickly (within 5 minutes) be thickened by too much
radiation, causing growth to stop, perhaps permanently. Narrow beams can be
accomplished by creating a narrow taper
(which we created and used but found difficult to move),
or by possibly
shaping the end surface of the
taper into a lens or adding other optics. Our experiment dealt with a simple fiber taper only and did not add
optics to its end or shape the end other than as flat and as half-sphere.
A variety of fiber tapers with
similar but varying optical characteristics were created. Best results were
achieved with a fiber which tapered to 1 micrometer through a length of 1 cm,
ending in a smooth, regular and un-chipped tip. 1 cm long
uncurved tapers were found to be
the best compromise between optical precision and fiber manipulability as light
loss is minimized and short tapers bend less at the air-liquid interface when
being partially immersed in the cell culture solution.
1.1 Taper Characteristics in Detail
Fiber tapers were analyzed under a
microscope[j]. Tapers of two shapes were
selected: a ��narrow��class
of tapers with a tip width of 0.1��m (as narrow as the cell neurites) and a ��micrometer��class of tapers, with a tip width of 1��m (1x to 4x the width of the neurites). Viewing through a video microscope[k] allowed eye safe visual
characterization of the emitted beam by projecting it through a cloudy
solution. Narrow
tapers were found to have lower divergence of 15 to 30 degrees because the
emitting end was flatter. The
narrow type also had higher light loss
which could be linked to bending (up to 45 degrees) of the fiber at the air -
liquid interface where the fiber entered the liquid in the sample dish. Micrometer tapers had a projected beam with
a 45 to 120 degree divergence and less light loss, the fiber was unaffected by
bending at the air-liquid interface. Beam divergence in
culture liquid was low (less than 5 degrees) for
fiber tips that were flat, and high (15 to 120 degrees) for rounded fiber tips.
Micrometer
tapers were then created with
a divergence near 90 degrees.
We did not
re-coat the exposed fiber taper area with a new reflection layer, which,
considering that the refractive index of water10 (about 1.3) and that of fused silica11 (about
1.5) are so close, care must be taken to keep the fiber straight as small bends
will leak light. For this reason we chose to use thicker fiber tapers which
were less prone to bending when unsupported.
We tried fiber tapers with many diversion angles between 90o and 10o, but the fiber tapers we used in this experiment had a diversion measured to be 90o or
1/4th of a sphere.
1.2 Measuring beam characteristics under the microscope
The refractive index of air9 is about 1
and the index of water10 is about 1.3, so beam divergence from
the fiber tip measured in air is higher than in the culture liquid (which is
mostly water) The refractive index of the silica fiber11 is about
1.5. We measured beam divergence in culture solution by directing an LED laser emitting
808nm light into the fiber. The fiber was immersed in a cloudy culture solution. In a light-sealed
laboratory operators wearing laser safety glasses powered on the laser and set
an emitted power of 500mW. The beam from the fiber taper was projected in the
cloudy solution and imaged by the video microscope which is sensitive to
infrared light. The beam profile was measured from the microscope image to determine
divergence (figure 5).
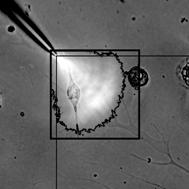
figure 1
The
dark black line surrounding the white area represents edge detection of the
beam, which can be compared to a 90o angle line superimposed on the image, showing near
90o divergence. Image contrast
increased, cropped.
Fiber
characteristics such as bends and imperfections in the fiber taper influence
light loss through the fiber. We primarily used the wider and higher divergence
micrometer class of tapers as this type had the least light loss as measured
through the microscope. The
rapid drop-off of energy with distance makes the ideal region of influence a
narrow band between 1 and 5��m from the end of a taper with 90
degree divergence.
There
is a change in the direction of extension of the growth edge toward the taper
tip within 2 or 3 minutes when the taper is emitting about 135mW with a
distance of between 1 and 5��m from the neurite
growth edge.
The energy of the beam can be approximately modeled as the following
relationship:
![]()
where
divergence div is 360o/90o = 4/1 = 4; r is
distance to a 1 ��m2 section of the target neurite. The model is diagramed in figure 4, showing v1,v3,v5,
as
increments of distance from the source of radiation at origin o0. Radiation
is about 161mW into
the fiber and light loss is about 16%, so the imaginary sphere surface at v1
has 135mW over a section with an area of about 3��m2.
1.3 Beam directability and usability.
The narrow fiber tapers produced
the least directable beam as a great percentage of light was lost before
emitting through the taper, the fiber was narrow enough to be highly influenced
by the air - liquid interface at the top of the sample dish, and was influenced
by fluid currents in the dish and was subject to drag induced bending when
moved unless supported externally. The large taper produced a well defined beam
with higher divergence, and was easy to precisely position.
1.4 Fiber Taper Construction
A 2m multimode optical fiber[i] was cut in half, and the
outside cover layers were stripped away with scissors. A 10cm section of the
interior fiber with the inner glass, reflection layer, and two outer polymer protective layers
was trimmed bare. The two outer protective layers were cut
through with scissors to the reflection layer. The protective layer was
carefully pulled to leave a gap of bare glass fiber between two protected
sections. The fiber's two protected sections were gripped with two hemostat
clamps and the bare section was heated over an alcohol flame while pulling the
fiber firmly to stretch and taper the fiber, and finally sever the two
protected sections. Varying heat, stretching speed, and tension allowed the production
of tapers down to 0.1��m (and less) wide and with tips varying from flat (when the
fiber cools more quickly) to semi-spherical (when the
fiber cools more slowly).
2. Light
power
The laser used in this expirament[l] is a 500mW 808nm
diode laser, calibrated in 2011-5 and 2012-7, the laser diode is directed into
the fiber through a two element lens. The fiber coupling is a FC connector for 150��m core (multimode) fiber.
We calibrated the light output from the end of the
fiber taper using a 1 cm2 silicon photodiode with a plastic
attenuation filter covering the diode so that the diode has a linear[16] light-to-current
response from 3mW to 150mW. The current generated from the photodiode receiving
light from another new, recently power-calibrated known-power laser source (measured
after the fiber) at 135mW was measured and then adjusted our expirament laser
to reach 135mW after the fiber tip.
We built a calibration curve linking the control
values for the laser power to fiber tip output power values. We then chose 135
mW as a permanent output value. All power variation was then managed as a
distance value of fiber tip to neurite surface and laser output power was held
constant. The laser was given a 20 minute warm up period.
Light
loss at entry into the fiber and attenuation8 in the
fiber is about 16%, 161mW output from the laser is about 135mW exiting from the
fiber taper.
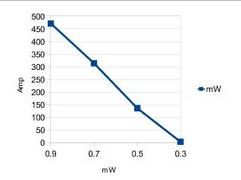
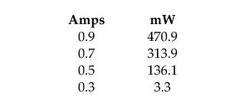
figure 3
Calibration
profile (2011-5) for the laser used in the expirament[l], We calibrated an after-the
fiber power for 135mW using the current from a photodiode and cross comparing
with another known-power laser (again after the fiber).
This is a simple laser power meter. The particle
content of the emitted light can be measured with a photocell, where each
photon interacting with the cell will release a photoelectron. Minus losses of
photons due to their not reaching or not interacting with the photodiode, we
have electrons that are measured as a current from the cell.
Photon flux can be measured with a photodiode if
adjustments are made for the particularities of the diode and its environment. 1mW
= about 3.9 x 10¹⁵ photons/second (and photelectrons/second from the
photodiode).
The photdiode will have a current response to
light, which is linear in a range that varies with each diode[16]. Our diode��s
linear response band is from 3 mW to 150mW after adding an attenuation filter.
The response plateaued after about 170mW. Response varies with temperature, but
this effect is far less than 1mW error per minute, our measurement was averaged
over 1 minute.
The light output drops off quickly with the
distance between the detector and the fiber tip, because the divergence of the
light emitted from the fiber tip is about 90 degrees, so we used a large photodiode
and placed the fiber tip close to it.
2. Cell Cultures
Two types of cells were used. Rat
cortex neurons[a] were extracted from rat pups
within 24 hours of birth, and PC12 cells[b] were cultured from frozen stored cells.
2.1 Rat cortex neurons:
2.1.1
Culture liquids:
Hepes buffered saline (��HBS��)
containing 10 mM HEPES[c], 140 mM NaCl, 5 mM KCl, 2mM CaCl��1mM MgCl, 10 mM glucose[d], pH 7.3, was always
filter-sterilized before use. Trypsin solution (bovine pancreas) [c] was dissolved in HBS to
1.25mg/ml plating and feeding media comprised of DMEM supplemented with high
glucose[e], 10% fetal bovine serum (��FBS��)[f], penicillin (100 U/mL) and
streptomycin (100 ��g/mL)[e]. Glutamine[g] was added to the media on the
day of use by diluting frozen stocks to a final concentration of 2 mM.
2.1.2
Culture dishes:
Plastic culture dishes[h] were coated with
L-polyornithine[c] prior before use. After 2 hours
of incubation, dishes were washed twice with DMEM before use.
2.1.3
Process:
Cortical tissue was isolated under
sterile conditions, rinsed in HBS, the meninges were removed and cut into 0.5mm
pieces. Tissues were placed over ice while being operated on.
The minced tissue (approximately
0.2 mL) was then treated with 4ml 0.125% pancreas solution for 15 min at 37��C
with gentle inversion every 5 minutes. Tissue was then triturated with a 1.5ml
pipet 15-20 times. A few drops of FBS were then added to stop digestion. Cells
were centrifuged at a rate of 1000 rpm for 10 minutes before the pancreas
solution was removed and replaced with 6 mL of pre-warmed plating medium. Cells
were again dispersed and then counted and adjusted to a maximum of 3.5��105
cells/mL. 2 mL of this cell solution was added to each 35-mm
L-polyornithine-coated dish.
Cells were then observed through a
video microscope (Olympus, 10x ocular, 40x objective) and found to be round and
floating in solution, with diameters of 2 to5��m. Cells were cultured in an
incubator at 37��C in 5% CO2 for 1 hour and then observed. Cells that
were round and plated to the bottom of the sample dish were accepted for use
and samples that did not appear healthy were not used.
2.2 PC12 cells
Feeding media comprised of DMEM
supplemented with high glucose[e], 10% horse serum and 5% fetal
calf serum [f], penicillin (100 U/mL) and
streptomycin (100 ��g/mL)[e].
Dish
media for PC12 cells were same[h] as for rat cortical cells.
2.3 Further processes for both types of cells:
After 6 hours of incubation cell
diameters were 5 to 10��m, and cells were observed to be growing neurites. After
12 hours of incubation, neurites had extended about 3 cell body lengths (15 to
30��m) away from the cell. Over a hundred samples were prepared, with about 10%
of our sample dishes left unused because the cells did not appear healthy
(healthy as indicated by cells plating to the bottom of the dish after
incubation).
The experiment was conducted in
sample dishes that were removed from incubation (37 degrees C, 5% CO2) and
placed under a microscope in open air at about 27 degrees C. Sample dishes were
plastic, coated with L-polyornithine which allows the cells to plate onto the
surface, and becomes a uniform traction surface for neurites to physically
interact with. Cells were examined to find growing neurites, cells were
examined at intervals of 30 seconds to find neurites which had moving growth
areas.
Additional
references
1.
Anders, J. J., Borke, R. C., Woolery, S. K. and van de Merwe, W. P. (1993), Low
power laser irradiation alters the rate of regeneration of the rat facial
nerve. Lasers in Surgery and Medicine, 13: 72�C82. doi: 10.1002/lsm.1900130113
2.
Higuchi, A., Kitamura, H., Shishimine, K., Konishi, S., Yoon, B.O., and Hara,
M. Visible light is able to regulate neurite outgrowth. J Biomater Sci Polym
Ed14, 1377, 2003.
3.
Higuchi, A., Watanabe, T., Matsubara, Y., Matsuoka, Y., and Hayashi, S.
Regulation of neurite outgrowth by intermittent irradiation of visible light. J
Phys Chem B 109, 11033, 2005.
4.
Higuchi, A., Watanabe, T., Noguchi, Y., Chang, Y., Chen, W.Y., and Matsuoka, Y.
Visible light regulates neurite out-growth of nerve cells. Cytotechnology 54,
181, 2007.
5.
Ehrlicher, A., Betz, T., Stuhrmann, B., Koch, D., Milner, V., Raizen, M.G., and
Kas, J. Guiding neuronal growth with light. Proc Natl Acad Sci USA 99, 16024,
2002.
6.
Wollman, Y., Rochkind, S., and Simantov , R. Low power laser irradiation
enhances migration and neurite sprouting of cultured rat embryonal brain cells.
Neurol Res 18, 467,1996.
7. Daniel
Koch, Timo Betz, Allen Ehrlicher, Michael Gogler, Bjorn Stuhrmann, Josef Kas,
Optical
control of neuronal growth. Proceedings of SPIE. Vol. SPIE-5514, pp. 428-436.
2004
8.
Fiber attenuation data 2.75dB/Km attenuation (at 800nm) - (data from corning.com)
9.
Philip E. Ciddor, Refractive index of air: new equations for the visible and
near infrared. Applied Optics, Vol. 35, Issue 9, pp. 1566-1573 (1996)
10.
P. Scheibener and J. Straub, J.M.H. Levelt Sengers and J.S. Gallagher,
Refractive Index of Water and Steam as Function of Wavelength, Temperature and
Density.
J.
Phys. Chem. Ref. Data 19, 677-715 (1990)
11.
Rei Kitamura, Laurent Pilon, and Miroslaw Jonasz, Optical constants of silica
glass from extreme ultraviolet to far infrared at near room temperature.
Applied
Optics, Vol. 46, Issue 33, pp. 8118-8133 (2007)
12. Harald Ries, Akiba Segal, and Jacob Karni,
Extracting concentrated guided light. Appl. Opt. 36, 2869-2874 (1997)
13. Catherine
E. Graves, Ryan G. McAllister, William J. Rosoff, Jeffrey S. Urbach, Optical
neuronal guidance in three-dimensional matrices.
Journal
of Neuroscience Methods, Volume 179, Issue 2, 15 May 2009, Pages 278�C283
14. Allen
Ehrlicher, Timo Betz, Björn Stuhrmann, Michael Gögler, Daniel Koch, Kristian
Franze, Yunbi Lu, Josef Käs, Optical Neuronal Guidance. Methods in Cell
Biology, Volume 83, 2007, Pages 495�C520
15. Valeri
Vasioukhin, Christoph Bauer, Mei Yin, Elaine Fuchs, Directed actin
polymerization is the driving force for epithelial cell-cell adhesion. Cell,
Volume 100, Issue 2, 21 January 2000, Pages 209�C219
16. Toomas Ku��
barsepp, Atte Haapalinna, Petri Ka�� rha��, Erkki Ikonen, Nonlinearity
measurements of silicon photodetectors. Applied
Optics, 1 May 1998.
Materials
[a] China Medical Science Institute
for Experimental Animal Research - �й�ҽѧ��ѧԺҽѧʵ�鶯���о���
[b] PC12
cells from 2 sources at Peking Union Medical Institute
Cell-Bank - ����Э��ϸ����;
and Wang Fei at Peking Union Medical Institute - ����Э��ҽѧԺ���
[c] Sigma-Aldrich Company
[d] Analytical pure, sourced in
China
[e] Thermo Fisher Scientific/Hyclone
[f] Hangzhou Sijiqing Biological
Engineering Materials Co. �����ļ��˾
[g] Invitrogen/Gibco
[h] Thermo Fisher Scientific/Nunc
[i] Beijing Zhongguancun Zhongfa
Electronics Supply Market, 3160
[j] Narishige MP-830 ocular 15x,
objective 35x
[k] Olympus 10x, 40x
[l] Beijing Viasho Technology Co., Ltd.
Notes
Calculations for the energy of the radiation at
various distances r (in ��m) from
the fiber taper tip. The preceeding vn corresponds to locations in figure 6.
v1 r = 1; area
�� 12��m2/4 = 3��m2; 135mw
/ 3 ��m2 =
45mW /��m2
v3 r = 3; area
�� 113��m2/4 = 28.25��m2; 135mw / 28.25��m2 =
4.8mW /��m2
v5 r = 5; area
�� 314��m2/4 =78.5��m2; 135mw / 78.5��m2 =
1.72mW /��m2
v7 r = 7; area
�� 615��m2/4 =153.8��m2; 135mw / 153.8��m2 =
0.88mW /��m2